Monday, 29 May 2017

12 Essential Tips to Picking a Website Color Scheme


colors
Did you know that 85 percent of shoppers base their product purchasing decisions on color?
It’s true.

At first, I found that stat to be amazing.
But after considering just how visually-driven we are as humans, it made total sense.
Visual stimuli guide nearly everything we do.
So why would it be any different when it comes to buying?
And just think about some of the world’s biggest brands.
Most tend to have a distinct color scheme associated with their brand identity.
For McDonald’s it’s red and yellow.

For Dell it’s blue.

And so on.

Color and branding

As we all know, establishing a solid brand identity is vitally important.
It’s a key ingredient in building trust, making consumers feel comfortable, and creating long-term brand advocates.
And what’s an integral part of a brand?

Its logo.
The color scheme that a company chooses for its logo is forever entwined with its brand identity.
According to research, “Color increases brand recognition by 80 percent.”

So I think it’s fair to say that color scheme is pretty important.
There’s something else to keep in mind. Brand color has a correlation with brand value.
Sure, there’s some cause/effect tradeoff, but take a look at these stats:
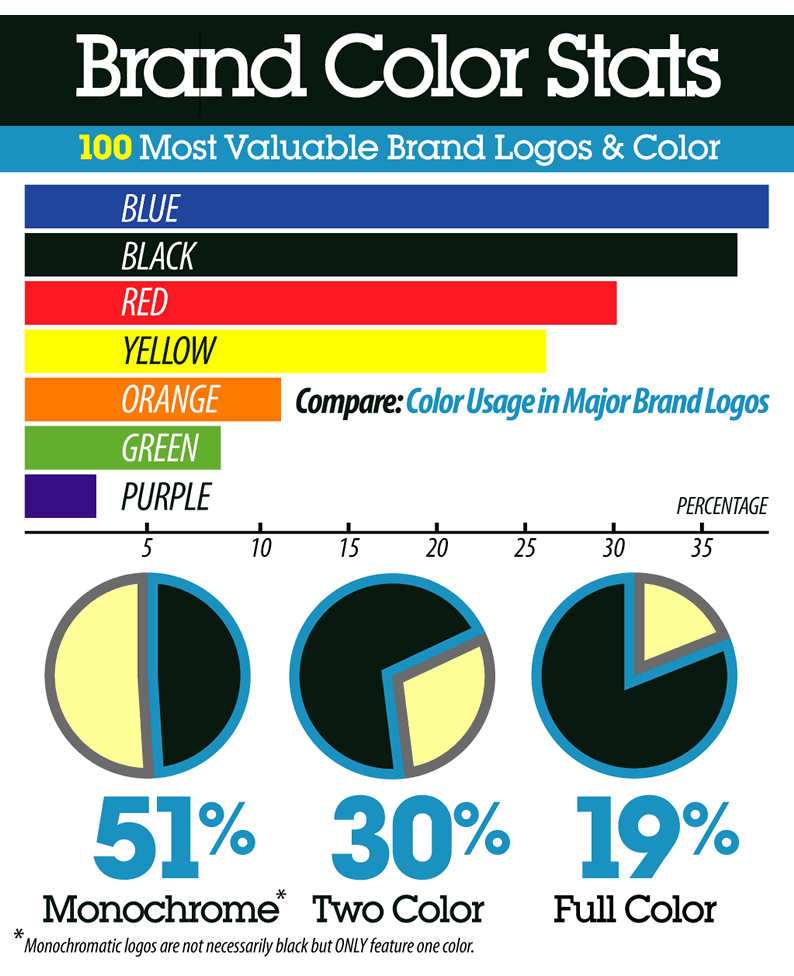
Valuable brands care about their colors. A lot!
If you were to go and mess with the colors of an existing brand, it would completely change how that brand is perceived.
Take a look at these examples from TheLogoFactory.com




You can instantly spot the artificial logos, and you feel something different surrounding that brand!

Website color scheme

Just like it’s crucial to choose the right color for your brand logo, it’s equally as crucial to choose the right color scheme for your website.You don’t want to pick your color scheme at random or base it on “whatever looks cool” to you.
Of course, you want awesome aesthetics and to “make it pop,” but color scheme is something that you want to give plenty of thought.
Why?
“People make a subconscious judgment about an environment or product within 90 seconds of initial viewing. Between 62 and 90 percent of that assessment is based on color alone.”
If you choose the right color scheme that’s naturally geared toward your demographic, you’ve already won half of the battle.
I would now like to offer 12 essential tips on how to pick the perfect website color scheme based on research and my own personal experience.

1. Understand how color affects emotion

The first thing I recommend is familiarizing yourself with how color affects humans on an emotional level.
Here’s a breakdown of how various CTA button colors affect shoppers in North America.
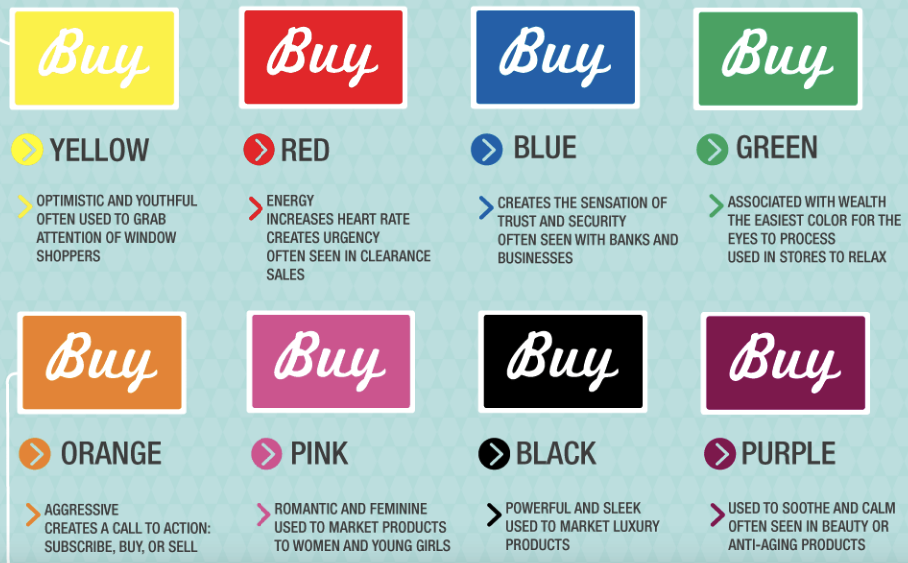
Note that the impact of color can vary depending on geographical location.
For instance, a color that appeals to American shoppers may not necessarily appeal to Indian shoppers.
I also came across the Color Emotion Guide that explains the emotions we associate with colors and provides some examples of brands that use each color.

I suggest spending some time looking at these examples and thinking about the psychological implications of the various colors.

2. Consider your overall demographic

Now I’d like you to think about your target demographic.Who is it you’re trying to reach and sell to?
What types of emotions are you trying to arouse?
These are extremely important questions to ask yourself.
I recommend checking out this information from Fast Company that explains the emotions and psychology behind common colors.
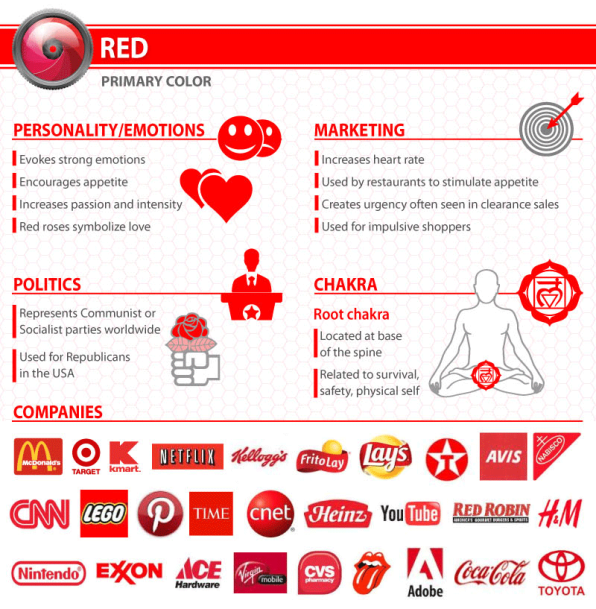
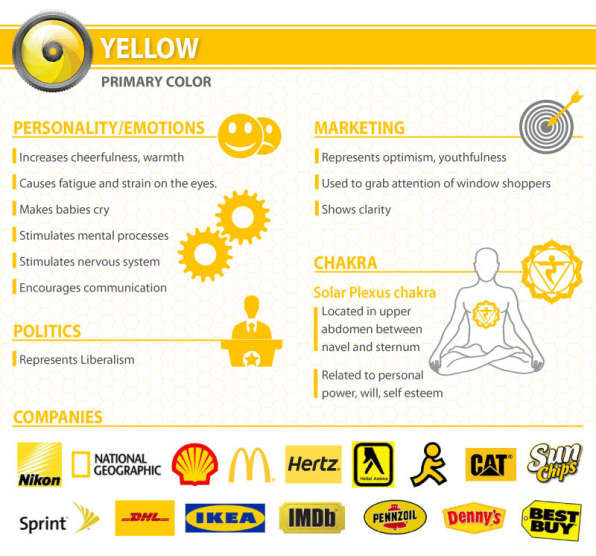
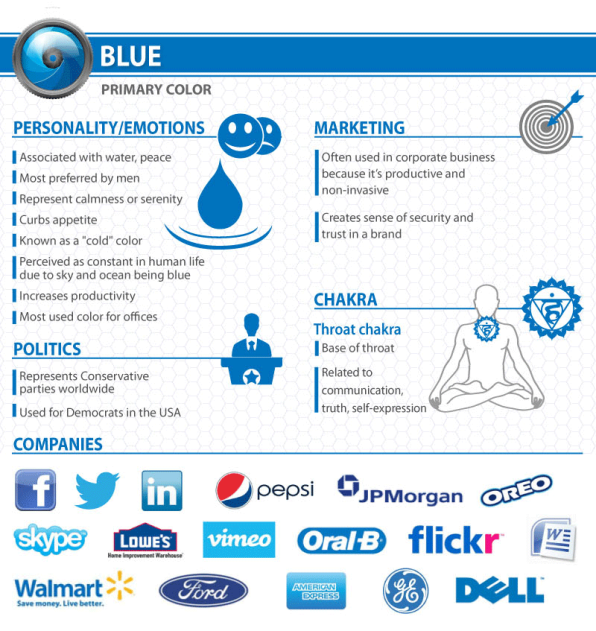
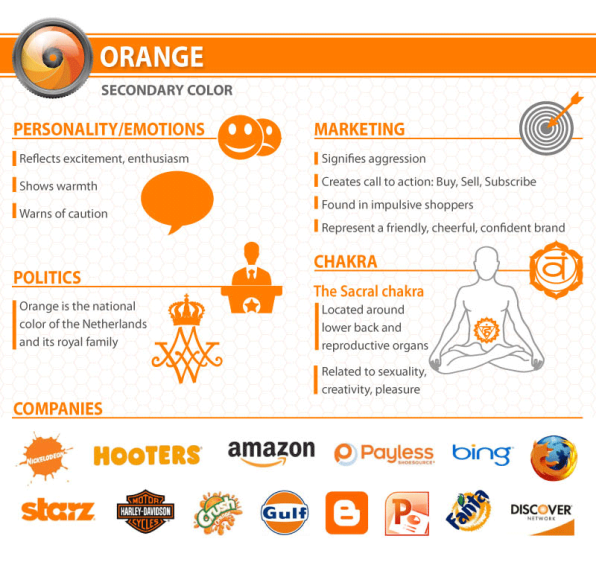
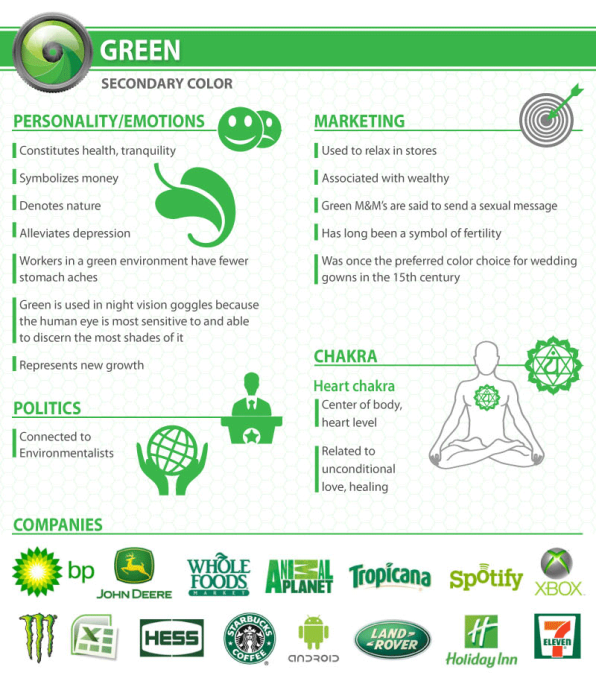
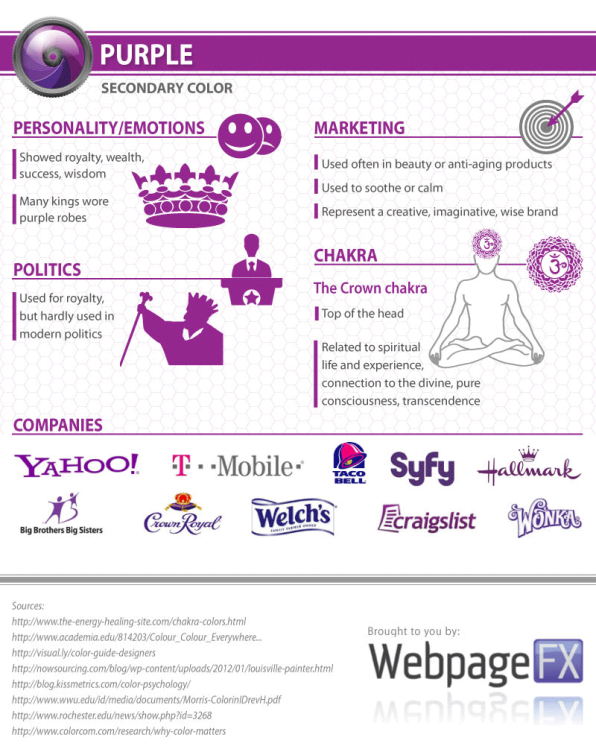
Consider the personality and emotions of your target audience.
Then choose the best color to serve as the primary color for your website color scheme.
For example, if you’re an organic food company, your best bet would probably be green because it’s associated with nature and health.

3. Consider gender

Although this won’t apply to everyone, some companies mostly cater to a specific gender.If you’re one of these companies, you’ll want to know what are men’s and women’s favorite and least favorite colors.
Research from Joe Hallock’s Colour Assignments found that on average each gender has definite color preferences.
Here’s what I mean.

As you can see, men really like blue and dislike brown and purple.
Women like blue and purple and dislike brown and orange.
This is just another factor to keep in mind.

4. Consider age group

Here’s something to think about that may not be obvious — age group.
Did you also know that a person’s color preferences can change with age?
According to research from Joe Hallock, it’s true.
Here are people’s favorite color by age group.

Here are people’s least favorite color by age group.

If a certain age group dominates your demographic, then this too will be a factor to consider.

5. Take “the color quiz”

If you need a little help deciding on a primary color, you may want to take this quiz from Grasshopper.
It will ask you things like “what best describes your customers” and “what type of product you offer.”
It’s quick and easy (only seven questions) but can point you in the right direction if you’re a little confused about which direction to take.

6. Let go of your biases

Here’s a mistake that I’ve seen many businesses make when choosing a color scheme.
And that’s basing it on their personal preferences rather than psychology.
If your favorite color is blue, it’s very tempting to make blue your primary color.
But if you’re a cosmetics company targeting a female demographic, this would be a mistake, and you would usually be better off going with purple or pink.
This is just something to keep in mind because you don’t want your own personal preferences to end up costing you sales and potentially diluting your brand over time.

7. Decide on how many colors to use

So at this point, you should have a primary color in mind.
Now it’s time to figure out how many colors you want to use in total.
While there’s no one-size-fits-all formula for this, I would like to point out something that’s called the 60-30-10 rule.
Long story short, this rule is used to come up with a color scheme in areas like interior design and fashion and involves dividing three colors into percentages to create a “perfect harmony.”
Here’s how it all breaks down.
  • 60 percent of a dominant color
  • 30 percent of a secondary color
  • 10 percent of an accent color
This means that the primary color will account for roughly 60 percent of the space on your website, the secondary color will account for 30 percent and the accent color will account for 10 percent.
If you want an example of the 60-30-10 rule, look no further than Quick Sprout.

Notice how green is the primary color, white is the secondary color and black is the accent color.
So when you boil it all down, this means that the ideal number of colors to use would be…drumroll please!
Three.
Now I’m not saying that you have to go with three colors, but it’s a good number to shoot for.
Using any more than four colors can make things complicated and downright ugly.

8. Choose your set of colors

What you want to do now is determine which set of colors you want to use.
Now I’m not a design expert, but one thing you’ll definitely want to achieve is contrast.
I personally prefer sites that have a light colored background with darker contrasts in the foreground.
This should make it easier on your visitors’ eyes and creates at least a certain amount of aesthetic appeal.
Here’s a good example.

However, there are sites that can pull off a dark background quite well.
Take Wonder Bread for example.

9. Consult the color wheel

Remember back in art class when you learned about “the color wheel?”
Well, it can be a huge help for choosing a website color scheme.
What you want to do is choose either “analogous colors” that are similar and next to each other on the color wheel or “complementary colors” that are directly opposite each other on the color wheel.
Here’s what I’m talking about.

One choice for complementary colors would be yellow and purple.
Another would be green and orange.
One choice for analogous colors would be orange and red.
Another would be green and blue.

10. Use tools for help

Here’s a tip for streamlining the process.
Use a tool like Colorspire.

It gives you a quick and easy way to test out different color combinations to give you a better idea of how they would actually look on your website.
This can save you a lot of time and should help you find the color combination that’s just right.
Or if Colorspire doesn’t tickle your fancy, I recommend looking at this list of awesome tools for choosing a website color scheme.

11. Check out the competition

You can also learn a lot from competitors in your industry.
I recommend checking out at least three websites of direct competitors and looking for overarching patterns in their color scheme.
This should give you a sense of what types of tones they’re using.
From there you have one of two choices.
  1. Create a similar color scheme that fits the conventional mold
  2. Go the opposite direction in order to differentiate yourself from the pack
I’m personally a proponent of the second choice if you’re looking to establish a distinctive brand.

12. Compare a few different color schemes

Here’s the thing.
You don’t need to commit to the first color scheme you come up with.
In fact, that can be very limiting.
What I suggest is coming up with three or four different color schemes and compare each one side-by-side.
Have your colleagues or business partners do the same to get a sense of what works and what doesn’t.
Then narrow it down until you find the color scheme that fits your brand to a T.

Conclusion

You don’t need to be a world renown artist to come up with a workable website color scheme.
It’s just a matter of understanding the psychology behind color and the emotions that various colors conjure up.
You’ll also want to have a basic understanding of the 60-30-10 rule and how the color wheel works.
With a bit of experimentation and trial and error, you should be able to come up with the optimal website color scheme.
In the long run, this will enable you to make an emotional connection with more visitors and can contribute to a lower bounce rate, more time spent on your site, and a higher conversion rate.
All of which can have a tremendous impact on your business.
What factors do you take into consideration when choosing a color scheme?

How to Use Google Search Console to Drive 28% More Search Traffic


Do you know what question I get asked almost more than any other question?
It’s this one: “How do I get more traffic?”
People ask me this every single day.
I’ve learned that most people think getting traffic is pretty much a pipe dream. They think it will take month after month of hustling.
So it often surprises people when I tell them that they already have what they need to get a lot more traffic.
You have the ability right now, and it’s completely free.
It’s Google Search Console, also called GSC for short.
It used to be called Google Webmaster Tools, so if you remember using that, you’ll find GSC familiar.
This mega-powerful tool is one of Google’s gems. It’s not as popular as Google Analytics, but it packs a punch.
One of GSC’s tools is called Search Analytics, and you can use it to drive more traffic to your site. One of my clients increased their traffic by 28% just by using this free tool.
I’m going to break it down step by step, so even if you’ve never used Google Search Console before, you can pick it up just by reading this article.

What is Google Search Console?

GSC is a hub for all things related to your site.
Here’s how Google defines it:
Screen Shot 2017 05 22 at 7.15.53 PM
It allows you to tweak everything from structured data to spam issues and everything in between.
It’s a must-have tool for any site owner, but it’s often overlooked.
That’s a shame because GSC can deliver some amazing results when used correctly.
Here are just a few of the benefits of using GSC:
Screen Shot 2017 05 22 at 7.16.02 PM
It’s one of the most comprehensive free website resources out there.
In fact, it rivals many paid tools on the market. It’s not a replacement for all of them, but it’s an outstanding supplement to be used alongside other tools.
You’re probably wondering how an analysis tool like GSC will help you get more traffic.

I’ll explain this in detail as we go on, but basically, you’re going to use info from GSC to modify your content and your website strategies (e.g., marketing, SEO, advertising).
GSC is actually a suite of tools, and they’re all insanely helpful.
But for the purpose of driving traffic, we’re going to focus on the Search Analytics tool.
Screen Shot 2017 05 22 at 7.16.12 PM 2
Search Analytics shows you all the information about exactly how your site appears in the SERPs.
Here’s what you can do with it:
Screen Shot 2017 05 22 at 7.16.09 PM
Don’t worry, we’re going to unpack all of this. But already you can see why this is such a useful tool.
It allows you to laser focus on your traffic and analyzes how much you’re getting and why you’re getting it.

Getting data from Search Analytics

Let’s take a look at the Search Analytics interface.
Screen Shot 2017 05 22 at 7.16.12 PM 1
The top row gives you options to apply different filters to your reports.
Screen Shot 2017 05 22 at 7.16.12 PM
Here’s what each of them does:
The Clicks filter shows you how many clicks you’ve gotten from the SERPs.
The Impressions filter shows you how many SERP results people have seen. Google counts these impressions differently based on certain factors, but that’s really all you need to know.
The CTR (click-through rate) is probably a metric you’re familiar with. Google has a standardized formula for this: the click count divided by the impression count.
The Position filter gives you the average position of the topmost result of your site.
Altogether, these four filters give you a wide range of results.
The options in the next box allow you to refine your results further. These are grouping options that categorize the data for you.
Screen Shot 2017 05 22 at 7.16.12 PM copy
I’ll briefly go over each of them.
The Queries option returns a list of search terms that drove users to your site.
downloadidnleHuJlA2WMnUEXkHpuvdJlSNy1pWt
The Page option shows you which pages on your site appeared in search results.
downloadidDeW27iu4VcYshkGjtH2QDBcr4kF2JH
The Country option shows you where all of these searches came from.
downloadidwIkgmI5zCyoKKUSKMlAfkHhHCNS673
The Device option shows you which devices were used to search.
downloadidpdvwuxBKINdLBhRbRGP2HlAI4SfdDE
The Search Type option shows you if users used web search, video search, image search, or another type.
downloadidLS5WfStvZquiv0Op1rkMFf0ImzPir0
The Search Appearance option lets you use special filters. You might not always see this option since it requires you to have impressions for at least one of the other features.
downloadidscwVYf1r6qsFmIJ56czXWZMtHkjnug
Finally, the Date option lets you choose the timeframe.
downloadidWC9I5IWC9pfBibDgJZoY1J5XRkzZOP
Each option has a time and a place. I’ll walk you through each of them.

Optimize results that don’t get clicks


This is one of my favorite features in GSC.The idea here is to look for keywords with lots of impressions but few clicks and a low CTR.
These are keywords that tons of people are seeing, but they’re not actually visiting your site.
Since these keywords have high visibility, you can work on improving your SERP presence so more of those people click through to your site.
First, you have to run a simple report.
Start by clicking all four filters: Clicks, Impressions, CTR, and Position. (You don’t technically need the Position filter, but it’s nice to know.)
Screen Shot 2017 05 22 at 7.22.35 PM
Next, select the Queries option.
Screen Shot 2017 05 22 at 7.22.59 PM
Below the graph, you should see a list of keywords.
downloadidM4KSjChGUlGa4ff8CXdhalMohgjAHI
Those four filters you applied are available for each keyword:
downloadidn7toOqI8RFqO1NVExyMdXzlTeGcHfg
This will give you a great idea of how each keyword is performing with a high amount of detail.
Remember, you’re looking for keywords that have a high impression count, a low CTR, and a low number of clicks.
Try to find 5-10 keywords that meet these criteria. I suggest recording these in a spreadsheet.
At this point, I like running a search of my own.
You can just open Google in a new tab or window, or you can even use an incognito window in Google Chrome or change your IP address so Google gives more general results.
Search each keyword and take a look at the SERP result.
Screen Shot 2017 05 22 at 7.24.51 PM
Try to step back and look at these results objectively. Ask yourself why these aren’t getting that many clicks.
There could be several culprits here. The most common causes are a bad title tag or a bad meta description.
Let’s look at title tags first.

Tweak your title tags

Your title tag will often convince people to click on your SERP result.
It’s the biggest and most obvious part of your result.
Screen Shot 2017 05 22 at 7.24.51 PM 1
Your title tags have to be SEO friendly, but they also have to be compelling.
Think about it. You’re on a SERP with 8-9 other results. What’s going to help make yours stand out? An awesome title tag, that’s what.
A good title tag is well formatted and specific. You also don’t want it to be too long or else Google will cut it off.
Here’s a role model for title tags. I found this on page 1 of the SERPs for the query “best title tags.”
Screen Shot 2017 05 22 at 7.27.21 PM
Right away, you know if you want to check out the content or if you’d rather pass it up.
It’s short and super descriptive. You already know what the content will be like just from reading the title tag.
That’s what every title tag needs to do.
Now look at this title tag, also from page 1:
Screen Shot 2017 05 22 at 7.28.07 PM
This is a little…confusing.
Sure, it’s about title tags. But what about title tags? It’s unclear.

And 50% of the title tag is the brand name. Honestly, it feels like bad SEO to me.I know what you’re thinking: “But Your Site, it’s on page 1! It has to be good, right?”
Not necessarily. That’s why you need to consider both clicks and impressions.
Your page 1 result can get all the impressions in the world, but if your CTR is 0, that link is effectively worthless.
That’s why improving your title tag can be a game changer. In fact, I recommend you look at all of your title tags and see if you can make them better.
pasted image 0 122
So go back to all your SERP results. If the title tags don’t seem awesome to you, work on them until they’re irresistible.

Maximize your meta description

If your SERP links are performing poorly, it could also be your meta description.
The title tag is where users go to see what your content is all about. They check out the meta to learn all of the juicy details.
Screen Shot 2017 05 22 at 7.28.47 PM
Unfortunately, some meta descriptions can disappoint. And that almost always causes people to decide to not click on a link.
I’ve written about writing meta descriptions before, so I won’t go through every detail. I’ll just cover the important points.
First, make sure your meta description is clear.
Your meta description should summarize your content for people who are scanning the SERPs.
If your title tag reels someone in, your meta description needs to convince them to check out the content.
This description from VerticalResponse is exactly what I’m talking about:
Screen Shot 2017 05 22 at 7.30.05 PM 1
It leaves you with zero questions.
If a friend asked you what VerticalResponse is, you’d be able to answer.
But you don’t know everything about VerticalResponse. That’s critical for this next step.
Second, make readers curious.
Don’t make your meta description vague to create “curiosity.”
Instead, hype up your product and make your user wonder, “Hmm, what’s this all about?”
That VerticalResponse meta description does an excellent job of this:
Screen Shot 2017 05 22 at 7.30.05 PM
It makes you think, “Is it really that good? Why not check it out?”
Third, keep it short.
Google will cut off long meta descriptions. The right length is around 160 characters. When in doubt, make it shorter.

Find your mobile keywords

Mobile keyword research is a field of its own.
If you’re serious about enhancing your SEO, I recommend putting some time into it.
That being said, Search Analytics is great for a quick fix to your mobile SEO strategy.
Search Analytics can show you which keywords are being used for mobile.
To see this in action, look at the Devices option. You should see small text that says “No filter” below it.
Screen Shot 2017 05 20 at 6.17.25 PM
Click on that. You’ll see a few options. Click on “Filter devices.”
Screen Shot 2017 05 22 at 7.33.24 PM
You should see options for Desktop or Mobile. Select Mobile.
Screen Shot 2017 05 22 at 7.33.27 PM
Now you’ll see all of the keywords that mobile users are searching to find your site in the SERPs.
Once you know these keywords, you can implement them into your mobile SEO.

Find performance drops


Here’s something about Search Analytics that’s not obvious.By default, a Search Analytics report will only cover the last four weeks.
That means all the data you’re seeing is pretty fresh. But it also only represents one timeframe.
This can hide some issues.
For example, if one of your keywords is at position 11, you’d probably think it’s doing well.
But that keyword could have been at position 8 a couple of months ago.
To get the most out of Search Analytics, you need to get comfortable with adjusting dates.
It’s all in the Dates option. Right now, you’ll probably see that it says “Last 28 Days.”
Screen Shot 2017 05 22 at 7.34.27 PM
You can take a look at older dates, but what I really like to do is compare date ranges. This is one of SA’s handiest tools.
Click on the “Last 28 Days” text. You’ll see a box pop up:
Screen Shot 2017 05 22 at 7.34.35 PM
Click on “Compare date ranges.” Then you’ll see this:
Screen Shot 2017 05 22 at 7.34.46 PM
You can go with one of the preset options if you want. However, if you click the “Custom…” option, you get the ability to specify exact date ranges.
Screen Shot 2017 05 22 at 7.34.48 PM
I like this option because it’s super flexible.
Once you’ve set your date range, you should see something like this:
downloadidYo0rovEYUASxDrgDVktoYdjfT01gsY
In the first section, you can see how all of your metrics have changed:
downloadidkqpN5oLz2UHXaIUjBDzSo2RC409j4i
And the graph provides an interactive, visual analysis of your performance.
downloadid9UAmmSd7mlHL51mrEOEukht6Hw03qX
Here’s the really cool thing about the Dates feature.
When you change a date, you can change anything else you want, and the dates will stay the same.
I love this about Search Analytics. It’s really flexible and does everything you tell it to.
And if you want to return to the default view, just go to Dates > Last 28 days > Reset (Last 28 days).
Screen Shot 2017 05 22 at 7.38.58 PM
One thing I should mention: The furthest back in time Search Analytics can go is 90 days.
That means it is inherently a short-term analytics tool. But that doesn’t mean it’s not useful. Quite the opposite!
So let’s talk about how you can use all of this information.
Let’s say you’re comparing the last week to the last 90 days and you see a recent drop in impressions.
That means fewer people are seeing your search results.
So you could run a Google search yourself and see if you’ve been pushed down a few positions.
If you have, you know you need to recover your ranking.
That’s just one way to use these results.
You can use the Dates function to find any sort of drop in performance. That way, you’ll know where to start fixing it.

What do you do if nothing’s working?

Let’s say you’ve reworked all your title tags and meta descriptions. You’ve optimized for mobile keywords too. But you’re still seeing poor performance.
Or maybe you’re getting more clicks, but you’re seeing high bounce rates.
What do you do next?
It’s simple: Improve your content.
I’ve always said that content is the most important part of any strategy. At the end of the day, if your content is bad, no amount of SEO will make people love it.

Source: Squaretreemarketing.co.uk
If nothing else is working, try identifying problems within your content.
Is it not comprehensive enough? Is it lacking data? Find what’s making users bounce and fix it.
It’ll take some critical thinking, but it’ll help make your content better.
Even if your Search Analytics results are good, I still recommend constantly improving your content. It can make a world of difference, and your metrics will reflect that.